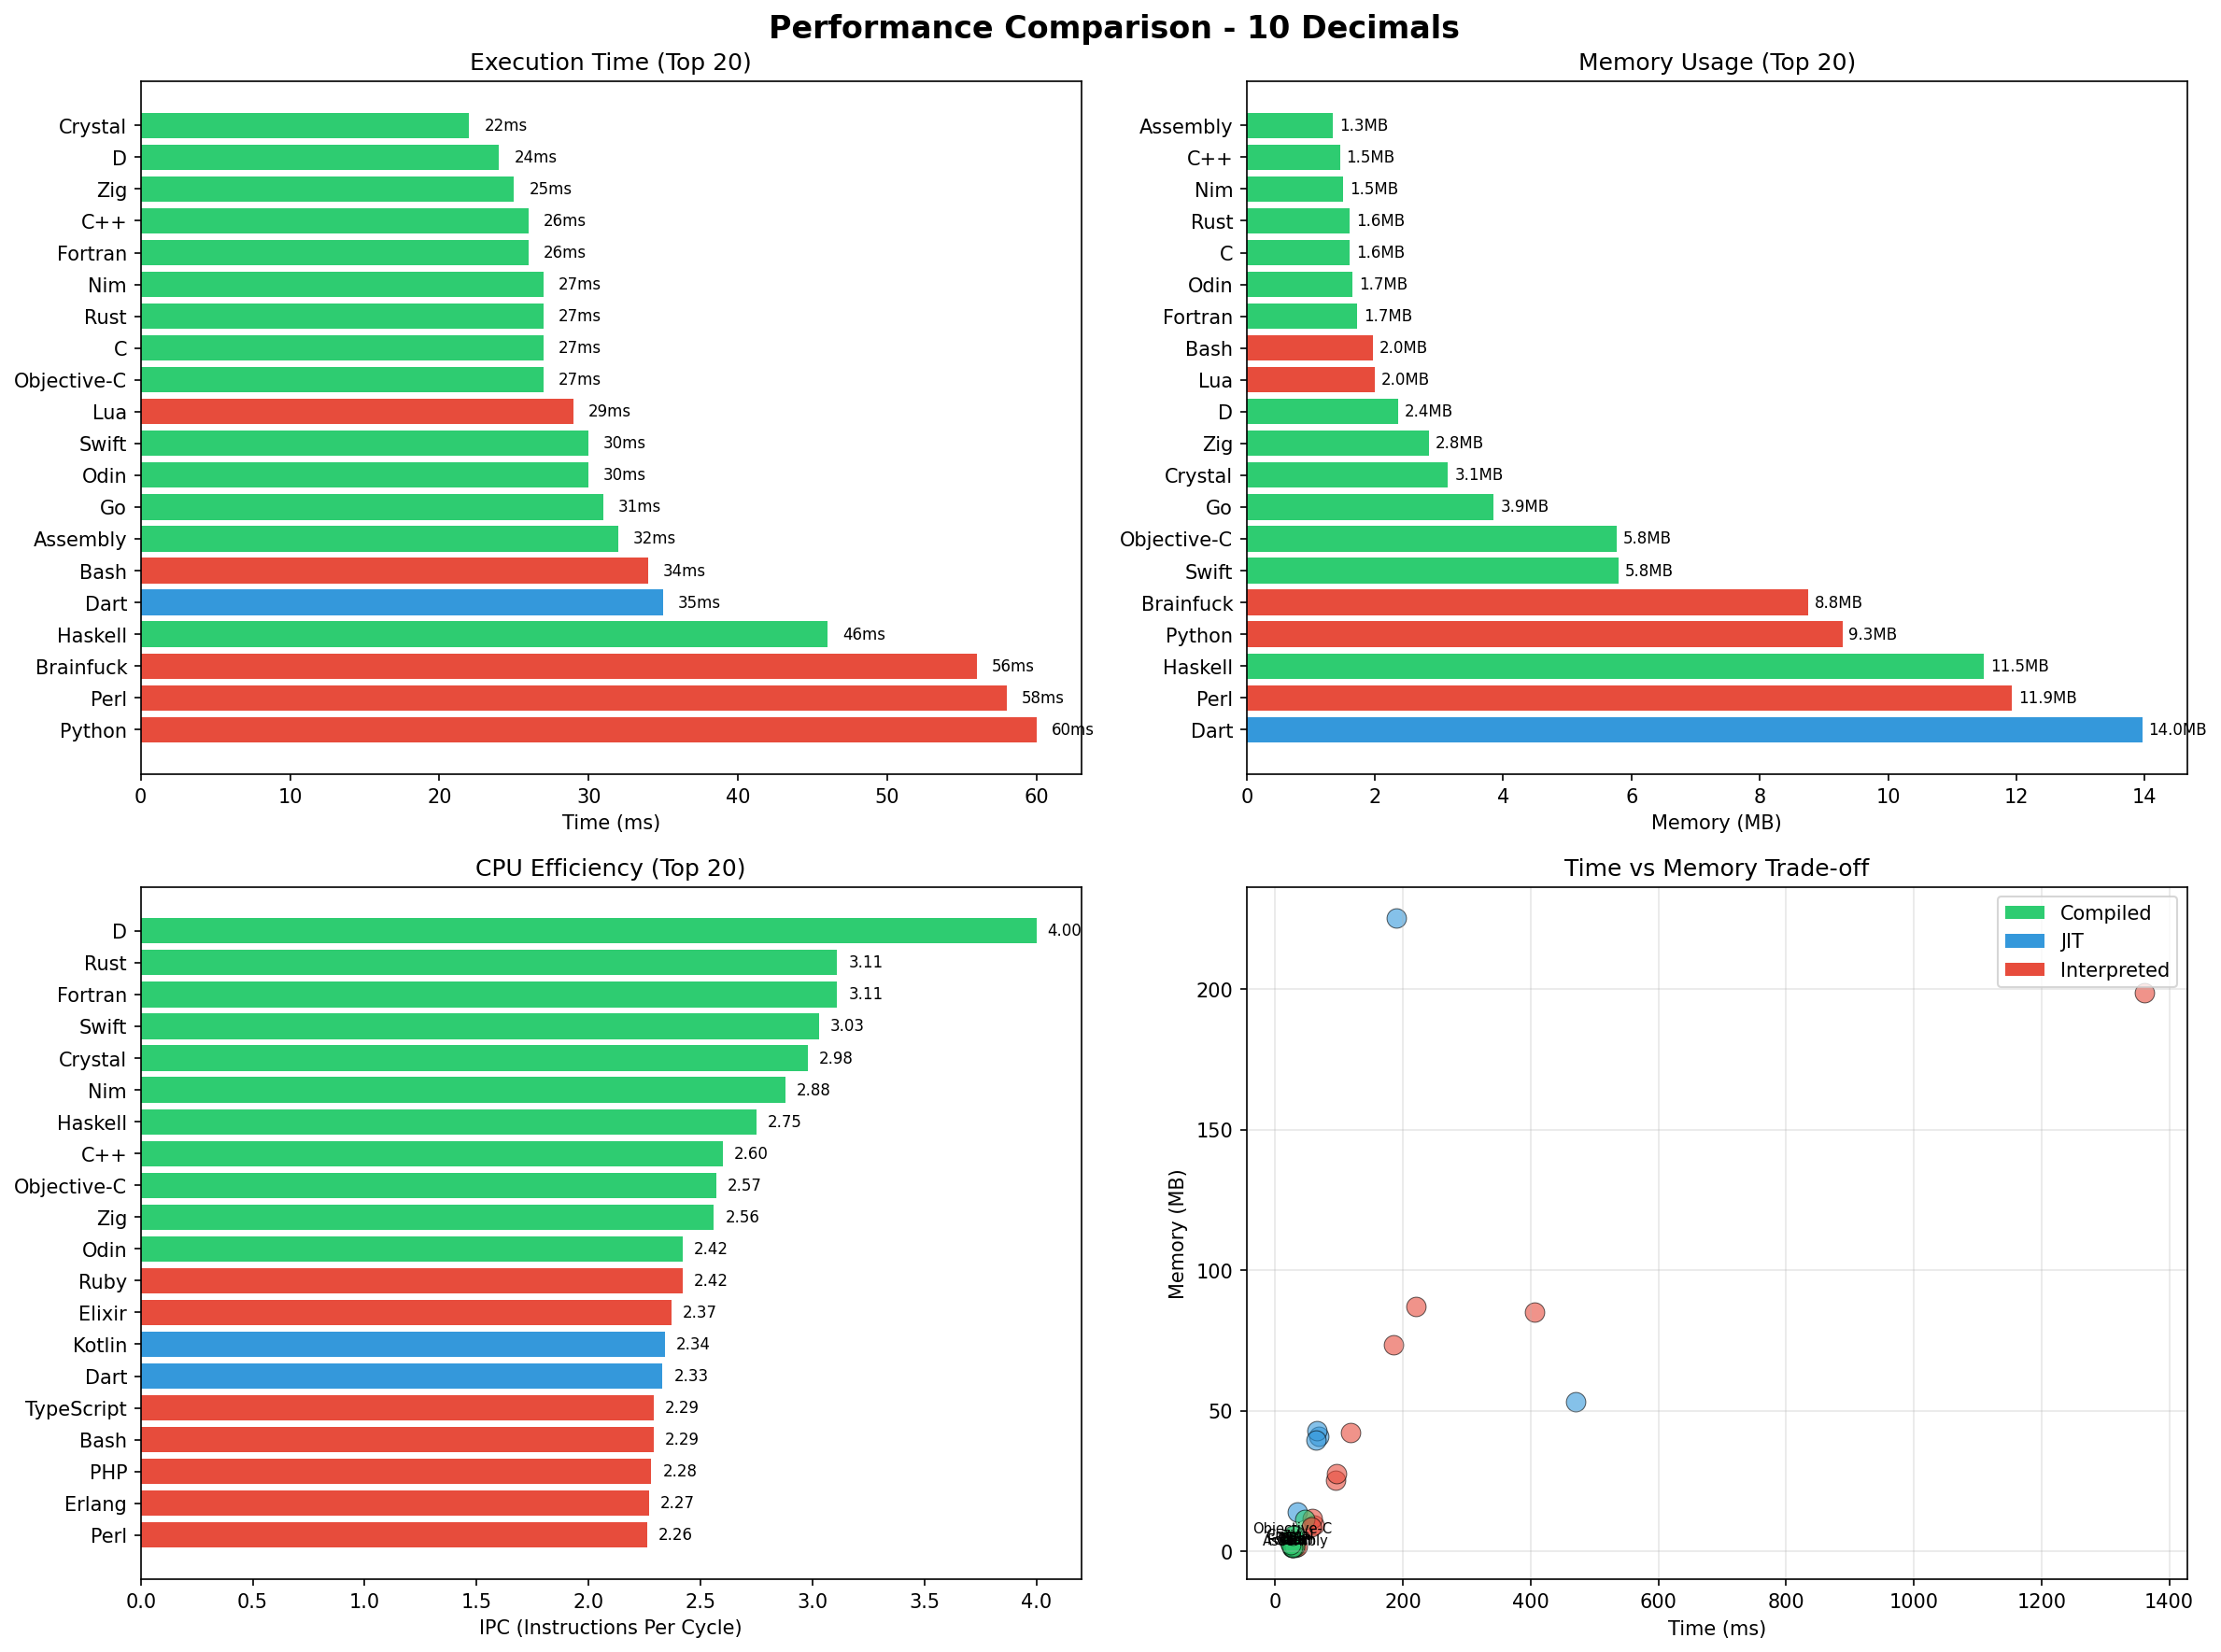
- Created performance charts for all decimal levels (1, 2, 5, 10, 100, 1000, 2000)
- Added 4 charts per report: execution time, memory usage, IPC efficiency, and time vs memory trade-off
- Updated all reports to include visualizations
- Charts show top 20 languages for each metric
- Color-coded by language type (Compiled=green, JIT=blue, Interpreted=red)
214 KiB
2378x1769px
214 KiB
2378x1769px